Electrification
Electrification Status and Time since Electrification
Access the data
Have more questions? Contact us
What are Atlas AI’s "Electrification Status" and "Time Since Electrification" layers?
Atlas AI’s Electrification Status layer estimates the availability of access to the electricity grid at a particular location, i.e. the presence or absence of electrification. At any snapshot in time, the Electrification Status is binary - either 'yes' or 'no'.
Atlas AI’s Time Since Electrification layer tracks when a specified location became electrified, i.e. when its Electrification Status changed from 'no' to 'yes'. This layer estimates the number of months since electricity was first observed to be available, visibly through the presence of night ligths in satellite imagery.
What is the spatial and temporal resolution of the Electrification Status layer?
| Temporal Extent | 2012 - 2020 |
| Temporal Resolution | Monthly |
| Spatial Coverage | African Continent (50 countries) and India unavailable for Cape Verde, Comoros, Mauritius, and Sao Tome & Principe |
| Spatial Resolution | 1 km x 1 km, with vectorized summary statistics at the national (admin 0), sub-national (admin 1), and local (admin 2 and below) levels of zonal aggregation |
What are the units of measurement for Electrification Status?
Binary indicator of electricity presence/absence at the 1 km x 1 km level of resolution Percentage of electrified 1 km x 1 km areas and population as a share of the national (admin 0), sub-national (admin 1), and local (admin 2 and below) levels of zonal aggregation
Our Electrification Status layer is updated twice a year, with an approximate six-month lag. Datasets are available in raster format (.tif) at a maximum spatial resolution of 1 km x 1 km in a systematic grid. Summary aggregations at zonal boundary levels are available by request in vector format (.shp) or tabular flat files (.csv).
What is the spatial and temporal resolution of the Time Since Electrification layer?
| Temporal Extent | 2012 - 2020 |
| Temporal Resolution | Monthly |
| Spatial Coverage | African Continent (50 countries) and South Asia unavailable for Afghanistan, Maldives, Cape Verde, Comoros, Mauritius, and Sao Tome & Principe |
| Spatial Resolution | 1 km x 1 km |
What are the units of measurement for Time Since Electrification?
Number of months since electrification, at the 1 km x 1 km level of resolution
Our Time Since Electrification layer is updated twice a year, with an approximate six-month lag, in parallel with our Electrification Status layer. Datasets are available in raster format (.tif) at a maximum spatial resolution of 1 km x 1 km in a systematic grid.
How does Atlas AI estimate Electrification Status and Time Since Electrification at high resolution?
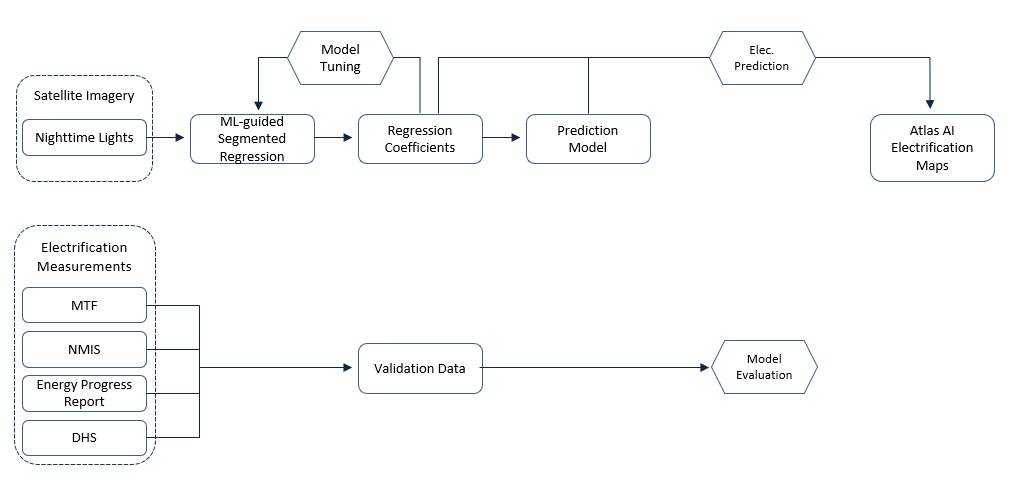
Figure 1. Machine Learning (ML) model overview with input data and outcome indicators
The primary input data for our Electrification and Time Since Electrification estimates are publicly accessible monthly nighttime lights data recorded by the day/night band (DNB) of Visible Infrared Imaging Radiometer Suite (VIIRS). Our proprietary methodology seeks to model the time series of luminosity as a piecewise linear regression. This allows us to identify the breakpoints between different linear regressions and then assess whether a given linear regression segment is more likely to be indicative of an area with or without electricity.
What are the main data sources we use?
We use the following publicly available data sources for model inputs, ground truthing, and model calibration.
| data source | how we use |
|---|---|
| Nighttime Lights (NL) | |
| Since 1994 the Earth Observation Group (EOG) at Colorado School of Mines has produced a time series of cloud-free composites of NL data by correcting raw NL data recorded by the Defense Meteorological Program (DMSP) and the Visible Infrared Imaging Radiometer Suite (VIIRS). | We calculate luminosity from monthly composites ranging from 2012 to 2020 inclusive. The value of a pixel in a composite represents radiance at that point in nanoWatt per square centimeter steradian (nW/cm2/sr). |
| Multi-Tier Energy Access Tracking Framework (MTF) | |
| The World Bank ESMAP program developed and launched the MTF in 2015 to measure energy access provided by any technology or fuel, for a spectrum of users at a national level. | We use MTF results to validate our electrification models. |
| Nigeria MDGs Information System (NMIS) | |
| A collaboration between the Government of Nigeria and Columbia University School of Engineering and Applied Science, NMIS created Nigeria’s first nation-wide inventory of health, water and education facilities. | We use 2009-2014 facilities data to validate our electrification models. |
| Tracking SDG7: The Energy Progress Report | |
| Formerly known as the Global Tracking Framework (GTF), the Energy Progress Report is a joint report of the Custodian Agencies – the International Energy Agency (IEA), the International Renewable Energy Agency (IRENA), the United Nations Statistics Division (UNSD), the World Bank, and the World Health Organization (WHO). It is funded by the Energy Sector Management Assistance Program (ESMAP). | We use national level estimates of electrification rates from 49 countries in Africa from 2012-2018, as an additional source of validation data. |
| Demographic and Health Surveys (DHS) Program | |
| Established by the United States Agency for International Development (USAID) in 1984, the DHS Program provides technical assistance in support of more that 350 surveys in 90 countries with intent to advance understanding of health and population trends in developing economies. | We validate our spending estimates against asset wealth correlates based on DHS survey data from over 30 countries between 2003 and 2016. |
How can I interpret my GeoTiff files?
| Value | Meaning |
|---|---|
| 1 | Not Electrified |
| 2 | Electrified |
How can I learn more?
For more details on the methodology and and publications that influenced our approach, we recommend the following citations as further reading:
- Falchetta, G., Pachauri, S., Parkinson, S., & Byers, E. A high-resolution gridded dataset to assess electrification in sub-Saharan Africa. Scientific Data: 6(1), 1-9 (2019) PAPER
- Falchetta, G., Pachauri, S., Byers, E., Danylo, O., & Parkinson, S. C. Satellite observations reveal inequalities in the progress and effectiveness of recent electrification in sub-Saharan Africa. One Earth: 2(4), 364-379 (2020). PAPER
- Dugoua, E., Kennedy, R., & Urpelainen, J. Satellite data for the social sciences: measuring rural electrification with night-time lights. International Journal of Remote Sensing, 39(9), 2690-2701 (2018). PAPER
Please reach out to us at info@atlasai.co if you have trouble accessing the full papers.
How can I explore the data?
Please reach out to us info@atlasai.co if you have trouble creating a free evaluation account on our proprietary platfrom ApertureTM, or would like to request a free data sample for evaluation prior to purchase.
Access the data
Have more questions? Contact us