Household Spending per Capita-Day
Household Spending per Capita-Day
Access the data
Have more questions? Contact us
What is Atlas AI’s “Spending” layer?
Atlas AI’s Spending layer estimates Consumption Expenditure, a measure of how much households spend on the goods and services they consume. The term Consumption Expenditure is redundant because consumption indicates the volume of goods and services while expenditure attaches a monetary ($) value to that consumption. A simpler way to capture this idea is to say “spending”.
The Spending concept is one good way to measure economic well-being. It reflects what people need to spend money on for basic needs and services, as well as what they choose to spend money on for discretionary activities and goods. To make comparisons and calculations easier, we normalize this as household spending per person, per day.
What is the spatial and temporal resolution of the Spending layer?
| Temporal Extent | 2003 - 2020 |
| Temporal Resolution | Annual |
| Spatial Coverage | African Continent (50 countries) and India (Early access) unavailable for Cape Verde, Comoros, Mauritius, and Sao Tome & Principe |
| Spatial Resolution | 2 km x 2 km, with vectorized summary statistics at the national (admin 0), sub-national (admin 1), and local (admin 2 and below) levels of zonal aggregation |
We produce the Spending layer for every year from 2003 to 2020 inclusive. Datasets are available in raster format (.tif) at a maximum spatial resolution of 1 km x 1 km in a systematic grid. Summary aggregations at zonal boundary levels such as national (admin 0), sub-national (admin 1), or local (admin 2 and below) available by request in vector format (.shp) or tabular flat files (.csv).
What are the units of measurement for Spending?
2011 PPP dollars (International dollars) per person-day
In accordance with the World Bank’s approach to consumption expenditure measurement, our Spending layer uses 2011 USD Purchasing Power Parity as the unit of estimation. This PPP metric accounts for both changes over time in prices within countries (inflation) and differences in purchasing power between countries (the same good can have different prices in different countries). The most recent comprehensive price surveys that allow international comparison of purchasing power are from the year 2011, with benchmarks published in 2020. By accounting for price differences over time and between countries, our Spending layer enables meaningful comparison of real purchasing power and spending thresholds across regions and time periods.
How does Atlas AI estimate Spending at high resolution?
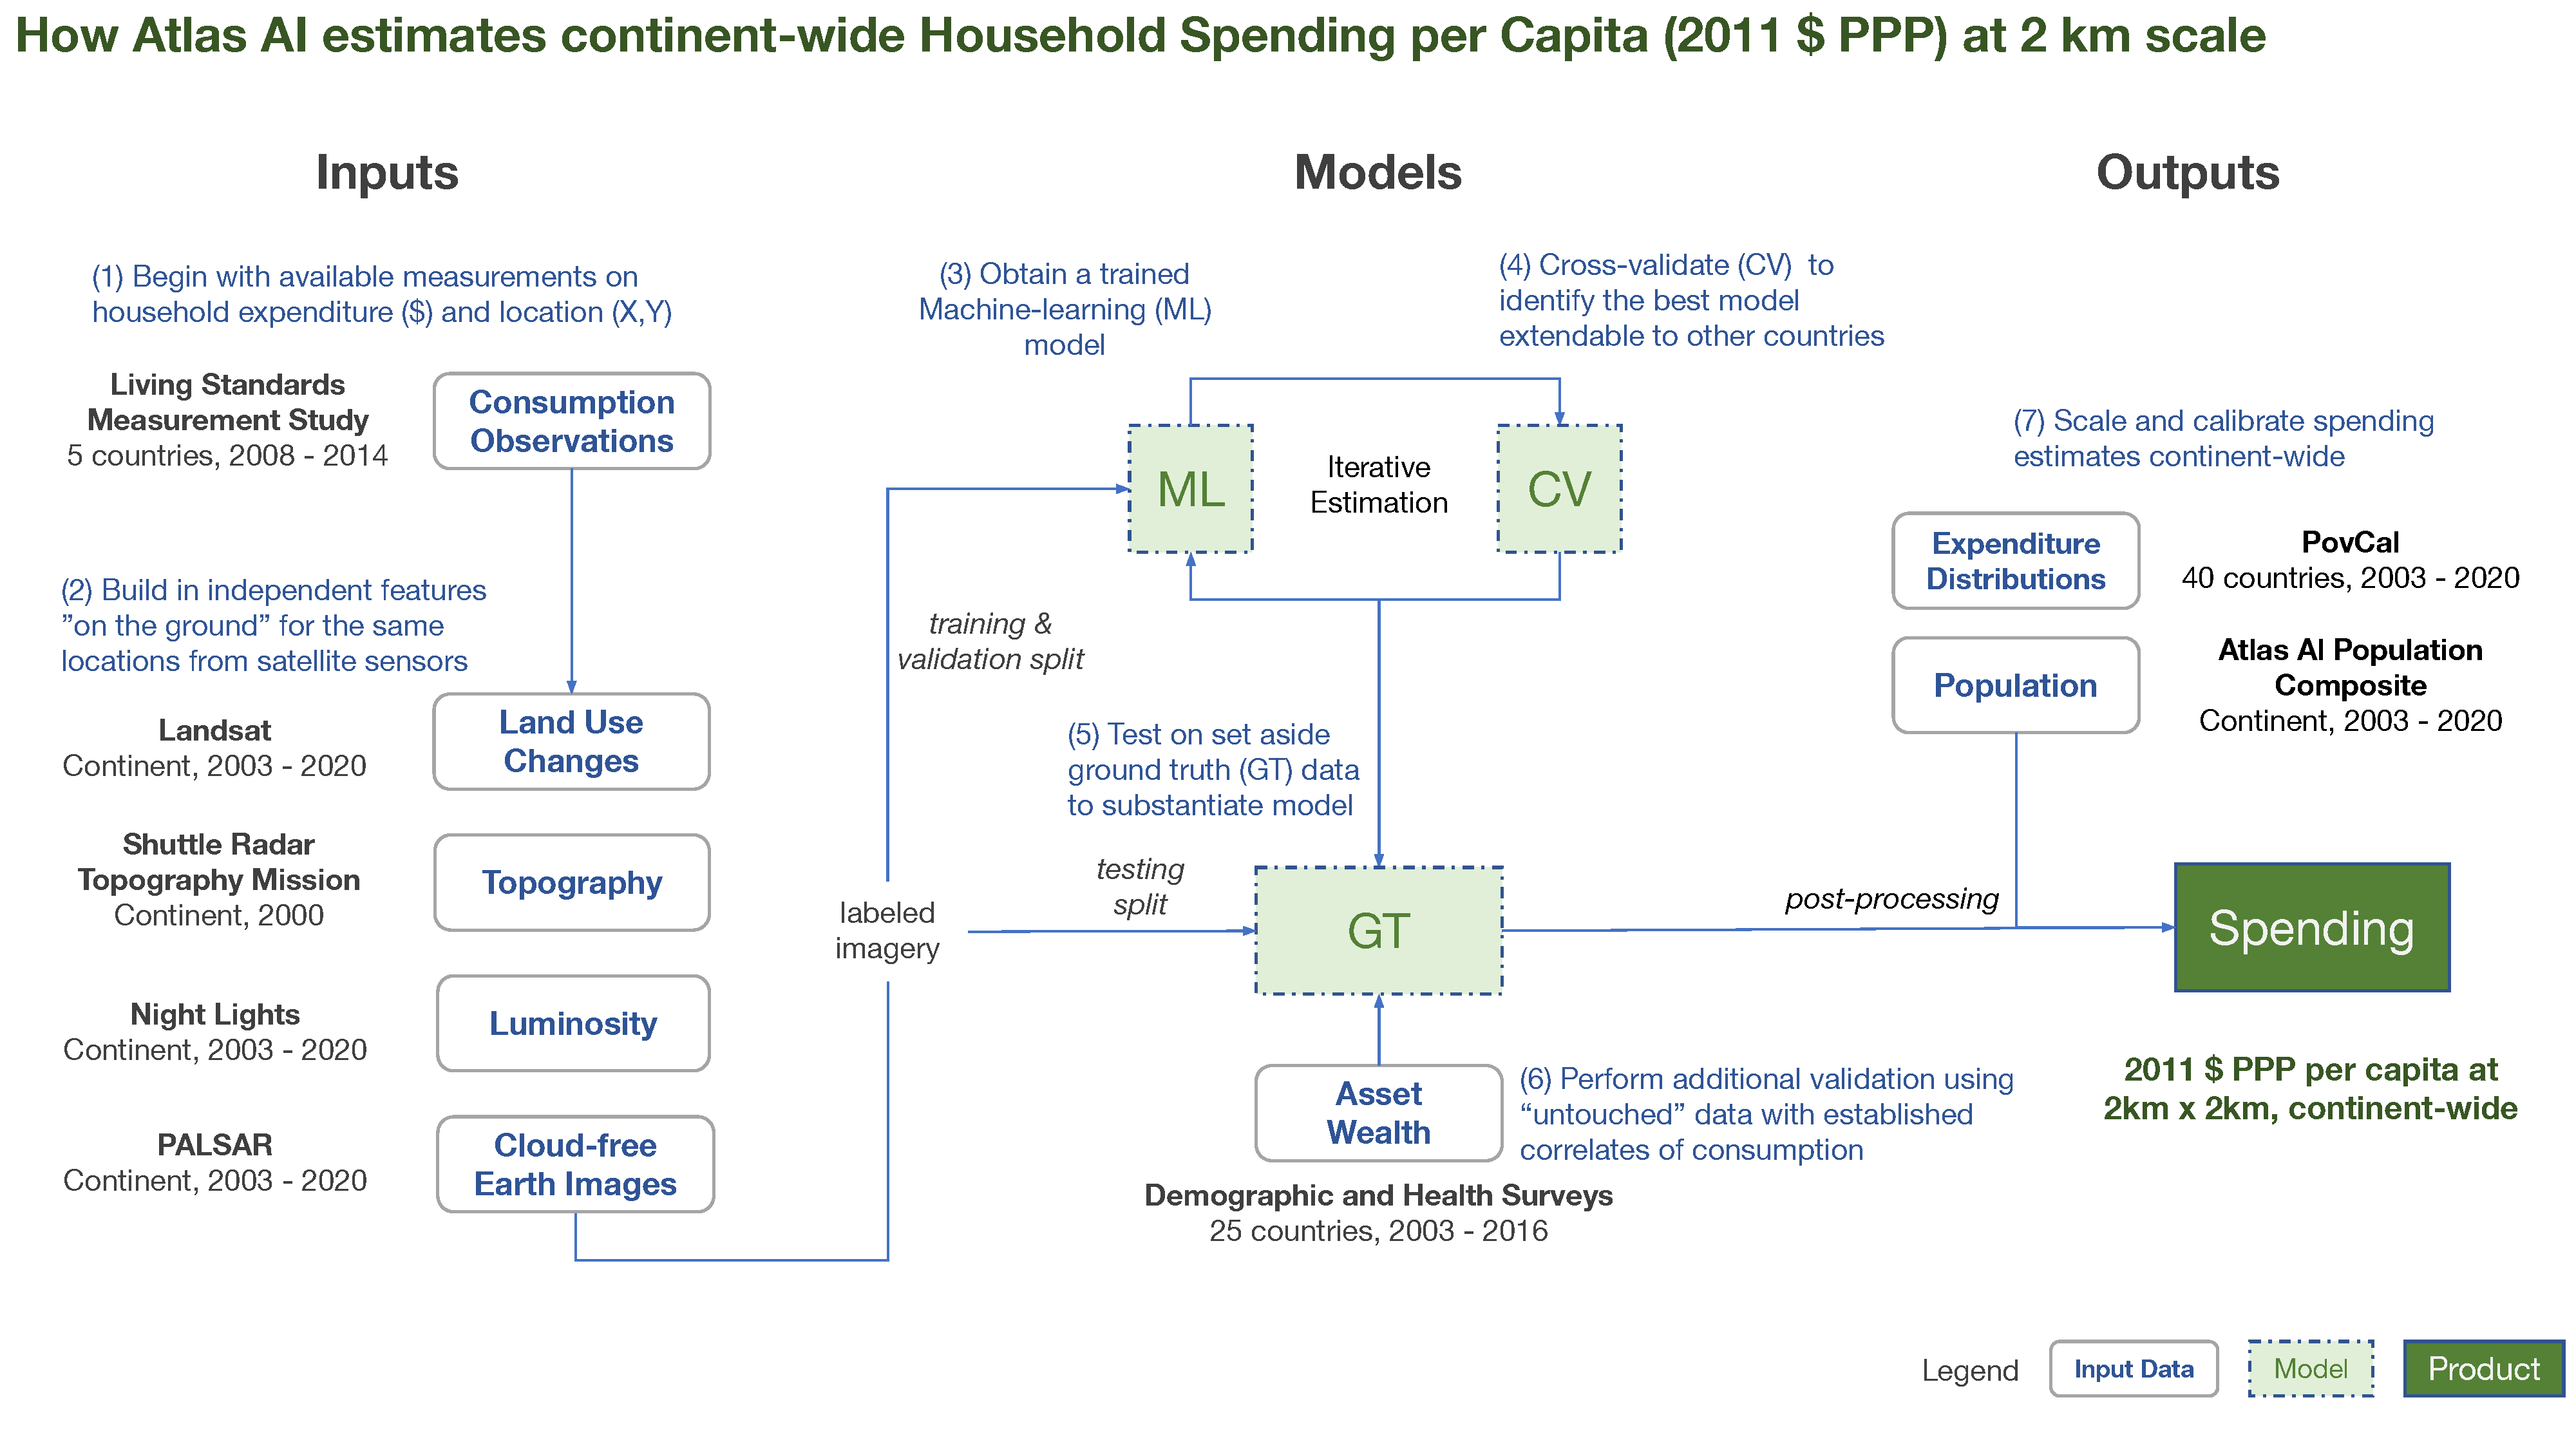
Figure 1. Machine Learning (ML) model overview with input data and outcome indicators
Our machine learning (ML) approach makes use of survey measurements and satellite imagery to estimate a consistent continent-wide data layer at high spatial resolution. Our approach can be explained in seven steps, as shown in the figure. Data sources are explained below.
Steps:
- The process begins with available household expenditure measurements ($) and their associated location (X,Y). Expenditure is the prediction (i.e. dependent variable) of interest.
- The next step builds in ”on the ground” observations from satellite sensors for the same (X,Y) locations. The features extracted from satellite imagery include land use changes, topography, luminosity, and cloud- and weather-free observations of the earth’s surface, and these can be thought of as independent variables. The first two steps together result in a set of labeled imagery as inputs into the machine-learning model.
- The input labeled imagery is then split into subsets for training, validation, and modeltesting. The ML model is initially developed with only the training subset of labels, so as to support later iterative improvements after cross-validation.
- The validation subset of labels enables a “leave one out” approach to iterative crossvalidation (CV) and model improvement. This approach identifies the most appropriate model for extending to countries and locations for which consumption measurements are not available. However the estimates are yet to be tested against “ground truth”, addressed in the two subsequent steps.
- Model performance for the chosen model is checked first against the ground truth (GT) test subset of labels. This substantiates the broad applicability of the model.
- An additional validation against ground truth uses hitherto untouched asset wealth estimates, the best correlates of consumption.
- The fully validated and ground-truthed model then undergoes a post-processing step. Two additional data sources are used to calibrate and scale spending estimates continent-wide. Calibration is aided by national-level distributions of poverty, and the continent-wide modeled estimates are finally scaled with high-resolution population estimates. The final outcome is a high-resolution layer of household spending per capita-day (1 km x 1 km).
What are the main data sources we use?
We use the following publicly available data sources for model inputs, ground truthing, and model calibration.
| data source | how we use |
|---|---|
| Living Standards Measurement Study (LSMS) | |
| Administered by the World Bank since the early 1980s, the LSMS is a flagship household survey program at the forefront of new data collection technologies in order to better respond to the changing data landscape and the shifting needs and priorities of client countries and the development community. | We extract reported household consumption expenditure and location from surveys for 5 countries conducted between 2008 and 2014, as the dependent variable. |
| Landsat | |
| Jointly managed by the National Aeronautics and Space Administration (NASA) and the United States Geological Survey (USGS), the Landsat Program has collected repetitive, calibrated spectral information from Earth’s surface for more than 40 years. | We use atmospherically corrected surface reflectance imagery obtained through Landsat 6, 7, and 8 between 2003 and 2020 to determine land cover as an independent model feature. |
| Shuttle Radar Topography Mission (SRTM) | |
| Jointly administered by NSAS and the U.S. National Geospatial-Intelligence Agency (NGA), the SRTM is an international research endeavor that generates a high resolution digital topographic database of Earth. | We use SRTM digital elevation data for the year 2000 at a resolution of 1 arc-second (approximately 30m), as an independent model feature. |
| Nighttime Lights (NL) | |
| Since 1994 the Earth Observation Group (EOG) at Colorado School of Mines has produced a time series of cloud-free composites of NL data by correcting raw NL data recorded by the Defense Meteorological Program (DMSP) and the Visible Infrared Imaging Radiometer Suite (VIIRS). | We calculate luminosity from the 2004-2005 DMSP median composites, 2010 DMSP median composites, 2014 VIIRS median composite, and the 2015-2020 VIIRS. |
| Phased Array type L-band Synthetic Aperture Radar (PALSAR) | |
| A collaboration between the Japan Aerospace Exploration Agency (JAXA) and the Japan Resources Observation System Organization (JAROS), PALSAR is a microwave sensor using L-band frequency to collect cloud-free and day-and-night earth observation imagery. | We use the 25 meter PALSAR yearly mosaic to support cloud- and weather-free observations for labeled imagery. |
| Demographic and Health Surveys (DHS) Program | |
| Established by the United States Agency for International Development (USAID) in 1984, the DHS Program provides technical assistance in support of more that 350 surveys in 90 countries with intent to advance understanding of health and population trends in developing economies. | We validate our spending estimates against asset wealth correlates based on DHS survey data from more than 30 countries between 2003 and 2016. |
| PovCal | |
| Developed by the World Bank's Development Research Group, PovcalNet is an interactive tool that enables users to replicate the calculations made by the World Bank's researchers in estimating the extent of absolute poverty in the world. | We calibrate our models using national poverty distributions from PovCal estimates for 40 countries for the years 2003 - 2020. |
How can I learn more?
For more details on our general methodology and published model metrics, we recommend the following citations as further reading:
- Yeh, C., Perez, A., Driscoll, A. et al. Using publicly available satellite imagery and deep learning to understand economic well-being in Africa. Nature Communications: 11, 2583 (2020) PAPER
- Jean, N., Burke, M., Xie, M., Davis, W. M., Lobell, D. B., & Ermon, S. Combining satellite imagery and machine learning to predict poverty. Science: 353(6301), 790-794 (2016) PAPER
Please reach out to us at info@atlasai.co if you have trouble accessing the full papers.
How can I explore the data?
Please reach out to us info@atlasai.co if you have trouble creating a free evaluation account on our proprietary platfrom ApertureTM, or would like to request a free data sample for evaluation prior to purchase.
Access the data
Have more questions? Contact us