Asset Wealth
Asset Wealth Index
Access the data
Have more questions? Contact us
What is Atlas AI’s "Asset Wealth" layer?
Atlas AI’s Asset Wealth layer estimates household asset wealth based on asset ownership.
Accurate and comprehensive measurements of economic well-being are fundamental inputs into commerce, research, and policy but such measures are unavailable at a local level in many parts of the world. Our Asset Wealth layer is produced from a deep learning model that predicts survey-based estimates from satellite imagery. To facilitate comparison within and across countries, we transformed Asset Wealth into a normalized index. The index is then also divided into nine quantiles (i.e. bins) for easily comparing the Asset Wealth estimate at a particular location to estimates for other locations.
What is the spatial and temporal resolution of the Asset Wealth layer?
| Temporal Extent | 2003 - 2020 |
| Temporal Resolution | Annual |
| Spatial Coverage | African Continent (50 countries) and South Asia unavailable for Afghanistan, Maldives, Cape Verde, Comoros, Mauritius, and Sao Tome & Principe |
| Spatial Resolution | 1 km x 1 km, with vectorized summary statistics at the national (admin 0), sub-national (admin 1), and local (admin 2 and below) levels of zonal aggregation |
We produce the Asset Wealth layer for every year from 2003 to 2020 inclusive. Datasets are available in raster format (.tif) at a maximum spatial resolution of 1 km x 1 km in a systematic grid. Summary aggregations at zonal boundary levels such as national (admin 0), sub-national (admin 1), or local (admin 2 and below) available by request in vector format (.shp) or tabular flat files (.csv).
What are the units of measurement for Asset Wealth?
A unitless index, and also binned into nine quantiles.
The nine-quantile index displays the average asset wealth of each area.
How does Atlas AI estimate the Asset Wealth Index at high resolution?
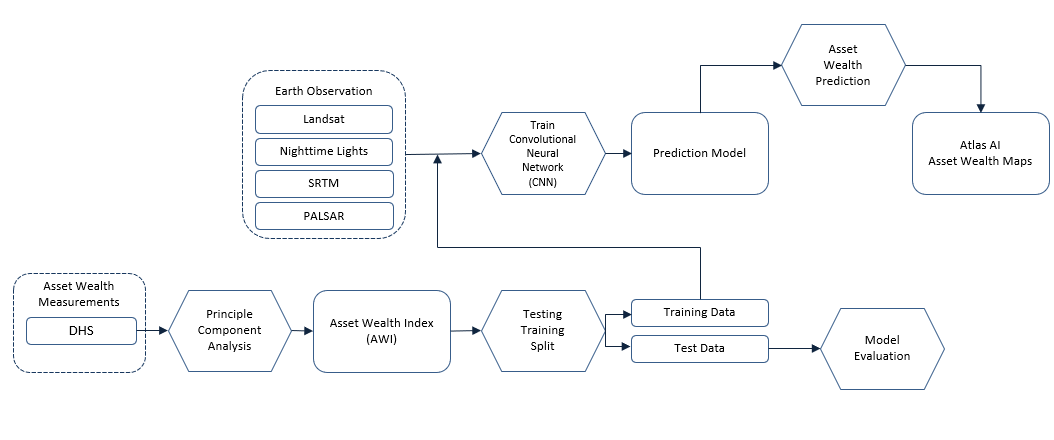
Figure 1. Machine Learning (ML) model overview with input data and outcome indicators
To generate these data, we collate locally-representative survey data on household asset ownership to create an Asset Wealth Index (AWI), which is the first principal component of a principal component analysis (PCA) computed on those assets over those households. We then train a random forest model to predict village-aggregated values with satellite imagery, validating on data the model was not trained on.
What are the main data sources we use?
We use the following publicly available data sources for model inputs, ground truthing, and model calibration.
| data source | how we use |
|---|---|
| Landsat | |
| Jointly managed by the National Aeronautics and Space Administration (NASA) and the United States Geological Survey (USGS), the Landsat Program has collected repetitive, calibrated spectral information from Earth’s surface for more than 40 years. | We use atmospherically corrected surface reflectance imagery obtained through Landsat 6, 7, and 8 between 2003 and 2020 to determine land cover as an independent model feature. |
| Shuttle Radar Topography Mission (SRTM) | |
| Jointly administered by NSAS and the U.S. National Geospatial-Intelligence Agency (NGA), the SRTM is an international research endeavor that generates a high resolution digital topographic database of Earth. | We use SRTM digital elevation data for the year 2000 at a resolution of 1 arc-second (approximately 30m), as an independent model feature. |
| Nighttime Lights (NL) | |
| Since 1994 the Earth Observation Group (EOG) at Colorado School of Mines has produced a time series of cloud-free composites of NL data by correcting raw NL data recorded by the Defense Meteorological Program (DMSP) and the Visible Infrared Imaging Radiometer Suite (VIIRS). | We calculate luminosity from the 2004-2005 DMSP median composites, 2010 DMSP median composites, 2014 VIIRS median composite, and the 2015-2020 VIIRS. |
| Phased Array type L-band Synthetic Aperture Radar (PALSAR) | |
| A collaboration between the Japan Aerospace Exploration Agency (JAXA) and the Japan Resources Observation System Organization (JAROS), PALSAR is a microwave sensor using L-band frequency to collect cloud-free and day-and-night earth observation imagery. | We use the 25 meter PALSAR yearly mosaic to support cloud- and weather-free observations for labeled imagery. |
| Demographic and Health Surveys (DHS) Program | |
| Established by the United States Agency for International Development (USAID) in 1984, the DHS Program provides technical assistance in support of more that 350 surveys in 90 countries with intent to advance understanding of health and population trends in developing economies. | Our models integrate DHS survey data from more than 30 countries, for surveys administered between 2003 and 2016. Our nine wealth quantiles were defined using our proprietary wealth index built on top of the DHS survey data. |
| Global Human Settlement Layer (GHSL) Population Data | |
| Supported by the Joint Research Centre (JRC) and the Directorate General for Regional and Urban Policy (DG REGIO) of the European Commission, together with the international partnership GEO Human Planet Initiative, the GHSL produces global spatial statistics about the human presence on Earth over time. | We use 250-meter population grid data from the years 2000 and 2015, and the 1 km settlement grid data. |
How can I interpret my GeoTiff files?
| Value | Meaning |
|---|---|
| 0 | Population Mask |
| 1 | 0th to 11th Percentile |
| 2 | 11th to 22nd Percentile |
| 3 | 22nd to 33rd Percentile |
| 4 | 33rd to 44th Percentile |
| 5 | 44th to 55th Percentile |
| 6 | 55th to 66th Percentile |
| 7 | 66th to 77th Percentile |
| 8 | 77th to 88th Percentile |
| 9 | 88th to 100th Percentile |
How can I learn more?
For more details on our general methodology and published model metrics, we recommend the following citations as further reading:
- Yeh, C., Perez, A., Driscoll, A. et al. Using publicly available satellite imagery and deep learning to understand economic well-being in Africa. Nature Communications: 11, 2583 (2020) PAPER
- Jean, N., Burke, M., Xie, M., Davis, W. M., Lobell, D. B., & Ermon, S. Combining satellite imagery and machine learning to predict poverty. Science: 353(6301), 790-794 (2016) PAPER
Please reach out to us info@atlasai.co if you have trouble accessing the full papers.
How can I explore the data?
Please reach out to us at info@atlasai.co if you have trouble creating a free evaluation account on our proprietary platfrom ApertureTM, or would like to request a free data sample for evaluation prior to purchase.
Access the data
Have more questions? Contact us